Key Takeaways
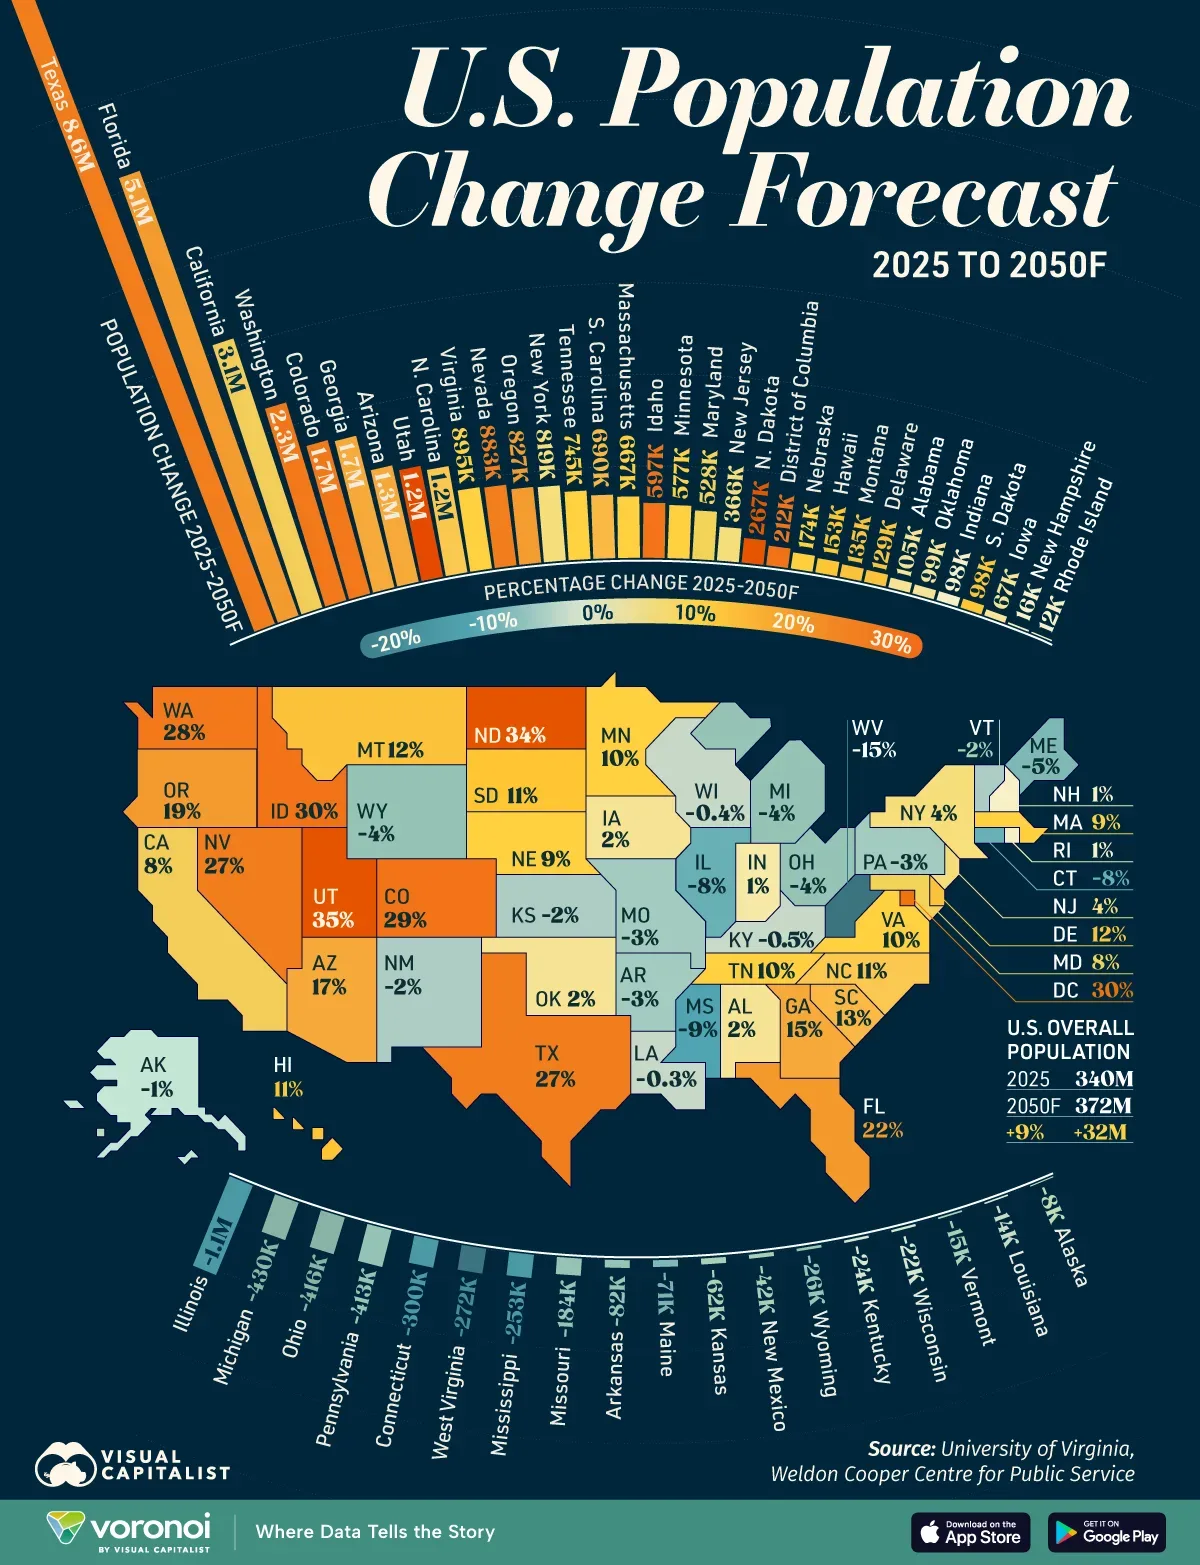
- The population of Texas is projected to grow by 8.6 million by 2050, rising by 28%.
- West Virginia’s population is forecast to decline 15%, the biggest decrease across states.
Over the next 25 years, Texas is projected to gain 8.6 million residents, the highest absolute increase across states. Like Texas, Florida and California are projected to lead nationally in population gains, adding 5.2 million and 3.1 million people, respectively. In comparison, 18 states are projected to shrink.
This graphic shows America’s fastest-growing states by 2050, based on forecasts from the University of Virginia.
| Ranking | State | Population Change 2025-2050F (Million) | % Change |
|---|---|---|---|
| 1 | Texas | 8.55 | 27% |
| 2 | Florida | 5.15 | 22% |
| 3 | California | 3.09 | 8% |
| 4 | Washington | 2.25 | 28% |
| 5 | Colorado | 1.73 | 29% |
| 6 | Georgia | 1.70 | 15% |
| 7 | Arizona | 1.30 | 17% |
| 8 | Utah | 1.23 | 35% |
| 9 | North Carolina | 1.17 | 11% |
| 10 | Virginia | 0.89 | 10% |
| 11 | Nevada | 0.88 | 27% |
| 12 | Oregon | 0.83 | 19% |
| 13 | New York | 0.82 | 4% |
| 14 | Tennessee | 0.75 | 10% |
| 15 | South Carolina | 0.69 | 13% |
| 16 | Massachusetts | 0.67 | 9% |
| 17 | Idaho | 0.60 | 30% |
| 18 | Minnesota | 0.58 | 10% |
| 19 | Maryland | 0.53 | 8% |
| 20 | New Jersey | 0.37 | 4% |
| 21 | North Dakota | 0.27 | 33% |
| 22 | District of Columbia | 0.21 | 30% |
| 23 | Nebraska | 0.17 | 9% |
| 24 | Hawaii | 0.15 | 11% |
| 25 | Montana | 0.14 | 12% |
| 26 | Delaware | 0.13 | 12% |
| 27 | Alabama | 0.11 | 2% |
| 28 | Oklahoma | 0.10 | 2% |
| 29 | Indiana | 0.10 | 1% |
| 30 | South Dakota | 0.10 | 11% |
| 31 | Iowa | 0.07 | 2% |
| 32 | New Hampshire | 0.02 | 1% |
| 33 | Rhode Island | 0.01 | 1% |
| 34 | Alaska | -0.01 | -1% |
| 35 | Louisiana | -0.01 | 0% |
| 36 | Vermont | -0.02 | -2% |
| 37 | Wisconsin | -0.02 | 0% |
| 38 | Kentucky | -0.02 | -1% |
| 39 | Wyoming | -0.03 | -4% |
| 40 | New Mexico | -0.04 | -2% |
| 41 | Kansas | -0.06 | -2% |
| 42 | Maine | -0.07 | -5% |
| 43 | Arkansas | -0.08 | -3% |
| 44 | Missouri | -0.18 | -3% |
| 45 | Mississippi | -0.25 | -9% |
| 46 | West Virginia | -0.27 | -15% |
| 47 | Connecticut | -0.30 | -8% |
| 48 | Pennsylvania | -0.41 | -3% |
| 49 | Ohio | -0.42 | -3% |
| 50 | Michigan | -0.43 | -4% |
| 51 | Illinois | -1.05 | -8% |
| Total | United States | 31.7 | 9% |
Read more: Visual Capitalist