Key Takeaways
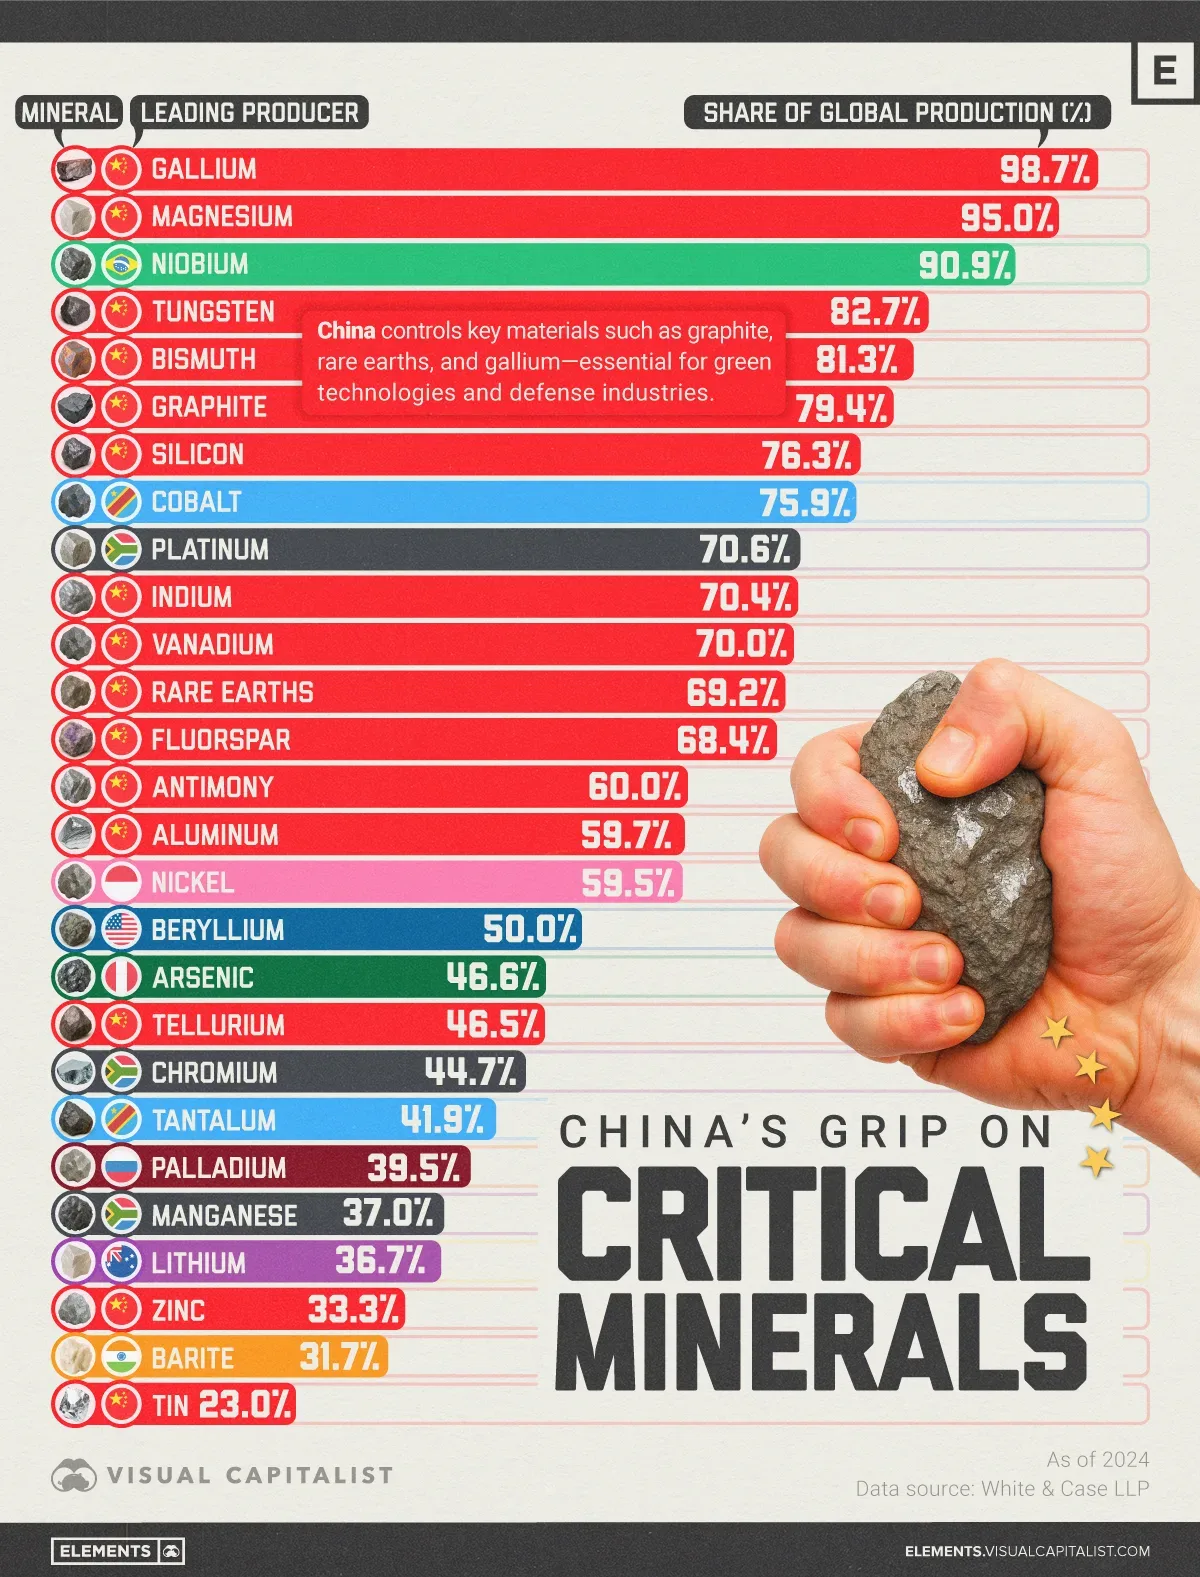
- China is the biggest producer for the majority of the materials listed.
- Other key players include Brazil, the Democratic Republic of Congo, and South Africa, each dominating select strategic materials.
China sits at the center of today’s global mineral supply chains. From electric vehicles to semiconductors, many of the technologies driving modern industry depend on critical minerals that are mined, refined, or controlled by China.
This visualization highlights just how concentrated global mineral production has become. The data for this graphic comes from White & Case LLP. It charts the top global producers for 27 key critical minerals, as of December 2024.
| Mineral | Major Producer | Global Production (%) |
|---|---|---|
| Gallium | 🇨🇳 China | 98.7% |
| Magnesium | 🇨🇳 China | 95.0% |
| Niobium | 🇧🇷 Brazil | 90.9% |
| Tungsten | 🇨🇳 China | 82.7% |
| Bismuth | 🇨🇳 China | 81.3% |
| Graphite | 🇨🇳 China | 79.4% |
| Silicon | 🇨🇳 China | 76.3% |
| Cobalt | 🇨🇩 DR Congo | 75.9% |
| Platinum | 🇿🇦 South Africa | 70.6% |
| Indium | 🇨🇳 China | 70.4% |
| Vanadium | 🇨🇳 China | 70.0% |
| Rare Earths | 🇨🇳 China | 69.2% |
| Fluorspar | 🇨🇳 China | 68.4% |
| Antimony | 🇨🇳 China | 60.0% |
| Aluminum | 🇨🇳 China | 59.7% |
| Nickel | 🇮🇩 Indonesia | 59.5% |
| Beryllium | 🇺🇸 U.S. | 50.0% |
| Arsenic | 🇵🇪 Peru | 46.6% |
| Tellurium | 🇨🇳 China | 46.5% |
| Chromium | 🇿🇦 South Africa | 44.7% |
| Tantalum | 🇨🇩 DR Congo | 41.9% |
| Palladium | 🇷🇺 Russia | 39.5% |
| Manganese | 🇿🇦 South Africa | 37.0% |
| Lithium | 🇦🇺 Australia | 36.7% |
| Zinc | 🇨🇳 China | 33.3% |
| Barite | 🇮🇳 India | 31.7% |
| Tin | 🇨🇳 China | 23.0% |
Read more: Visual Capitalist