Key Takeaways
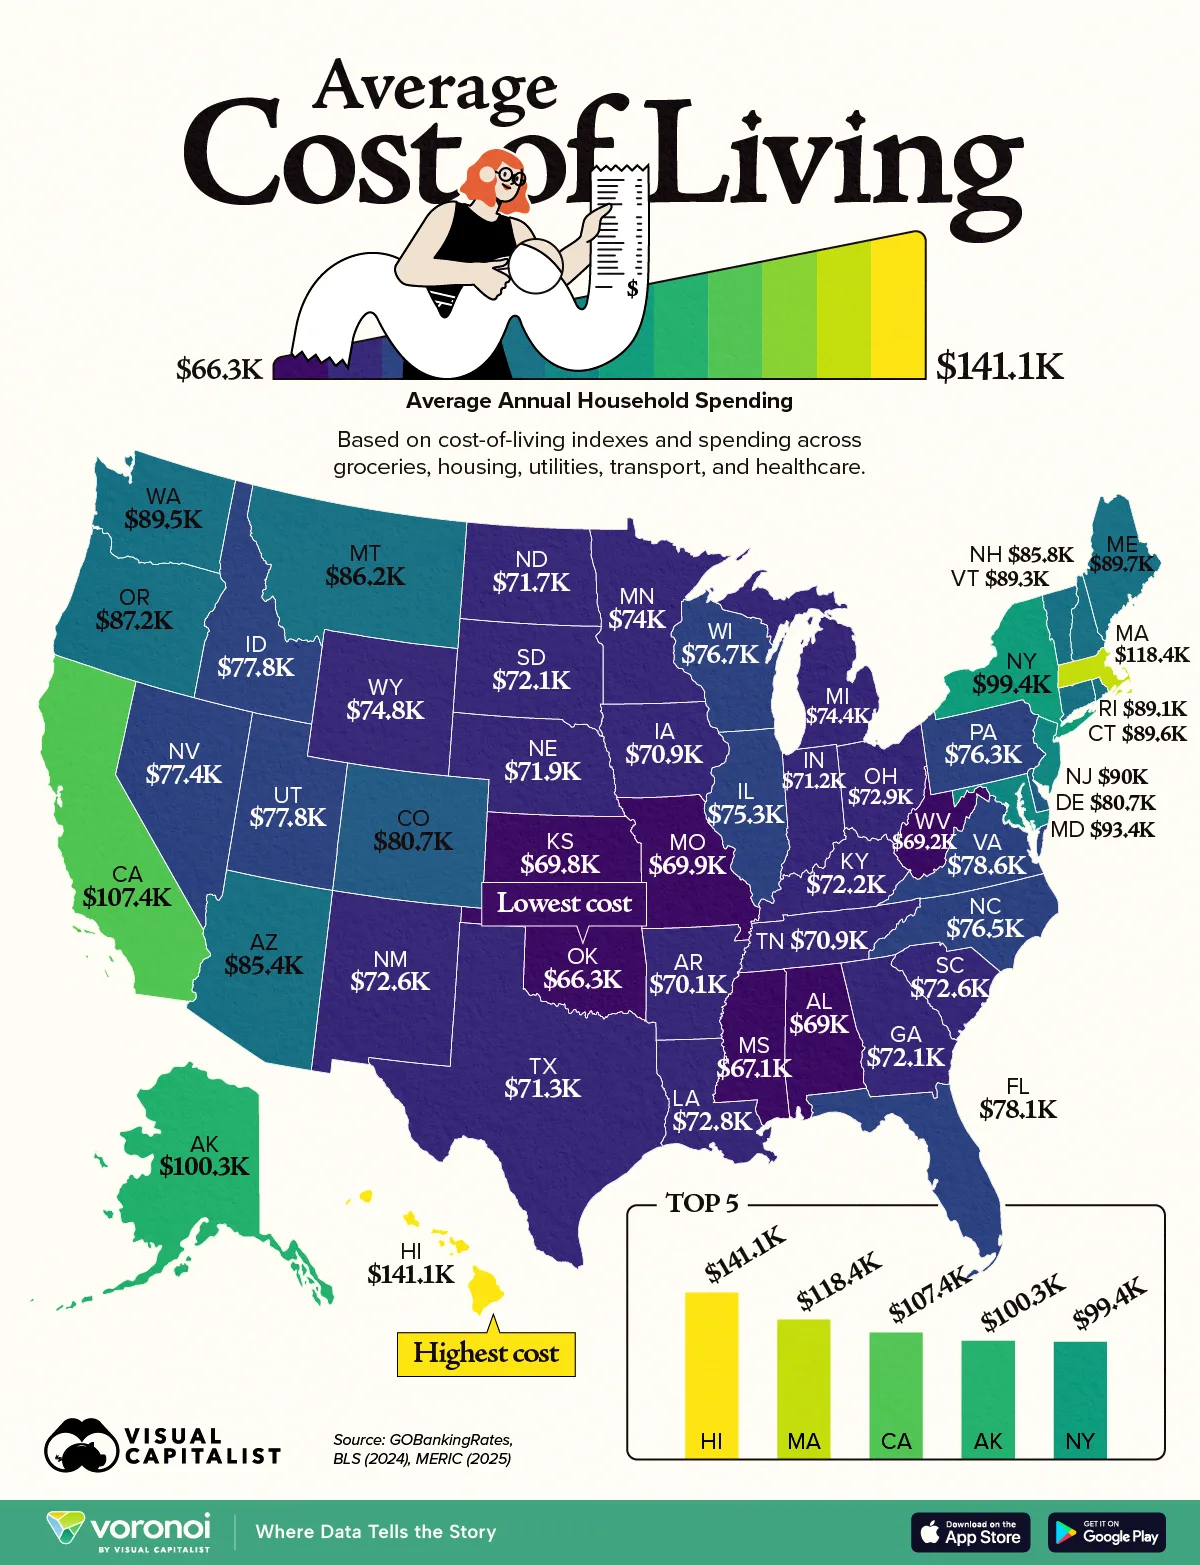
- Hawaii is the most expensive state, with annual household costs reaching $141,127.
- Oklahoma is the cheapest at $66,284, creating a gap of roughly $75,000 per year.
- Most states cluster between roughly $70,000 and $90,000, while coastal and remote states tend to cost far more.
Living in one U.S. state versus another can change your annual costs by as much as $75,000.
Using GOBankingRate’s analysis of the Bureau of Labor Statistics’ 2024 Consumer Expenditure Survey and Missouri Economic Research and Information Center data as of Q3 2025, this map shows how annual household costs vary across all 50 states.
From $141,127 in Hawaii to $66,284 in Oklahoma, the difference is stark. For many households, location alone can be one of the biggest drivers of overall cost.
| Rank | State | Annual Average Expenditures | Cost-of-Living Index |
|---|---|---|---|
| 1 | Hawaii | $141,127 | 179.7 |
| 2 | Massachusetts | $118,431 | 150.8 |
| 3 | California | $107,357 | 136.7 |
| 4 | Alaska | $100,289 | 127.7 |
| 5 | New York | $99,425 | 126.6 |
| 6 | Maryland | $93,378 | 118.9 |
| 7 | New Jersey | $90,001 | 114.6 |
| 8 | Maine | $89,687 | 114.2 |
| 9 | Connecticut | $89,608 | 114.1 |
| 10 | Washington | $89,451 | 113.9 |
| 11 | Vermont | $89,294 | 113.7 |
| 12 | Rhode Island | $89,059 | 113.4 |
| 13 | Oregon | $87,231 | 111.8 |
| 14 | Montana | $86,231 | 109.8 |
| 15 | New Hampshire | $85,760 | 109.2 |
| 16 | Arizona | $85,446 | 108.8 |
| 17 | Delaware | $80,734 | 102.8 |
| 18 | Colorado | $80,655 | 102.7 |
| 19 | Virginia | $78,614 | 100.1 |
| 20 | Florida | $78,142 | 99.5 |
| 21 | Utah | $77,828 | 99.1 |
| 22 | Idaho | $77,750 | 99.0 |
| 23 | Nevada | $77,436 | 98.6 |
| 24 | Wisconsin | $76,729 | 97.7 |
| 25 | North Carolina | $76,493 | 97.4 |
| 26 | Pennsylvania | $76,257 | 97.1 |
| 27 | Illinois | $75,315 | 95.9 |
| 28 | Wyoming | $74,844 | 95.3 |
| 29 | Michigan | $74,373 | 94.7 |
| 30 | Minnesota | $73,980 | 94.2 |
| 31 | Ohio | $72,880 | 92.8 |
| 32 | Louisiana | $72,802 | 92.7 |
| 33 | New Mexico | $72,645 | 92.5 |
| 34 | South Carolina | $72,645 | 92.5 |
| 35 | Kentucky | $72,174 | 91.9 |
| 36 | Georgia | $72,095 | 91.8 |
| 37 | South Dakota | $72,095 | 91.8 |
| 38 | Nebraska | $71,938 | 91.6 |
| 39 | North Dakota | $71,702 | 91.3 |
| 40 | Texas | $71,310 | 90.8 |
| 41 | Indiana | $71,153 | 90.6 |
| 42 | Iowa | $70,917 | 90.3 |
| 43 | Tennessee | $70,917 | 90.3 |
| 44 | Arkansas | $70,132 | 89.3 |
| 45 | Missouri | $69,896 | 89.0 |
| 46 | Kansas | $69,818 | 88.9 |
| 47 | West Virginia | $69,189 | 88.1 |
| 48 | Alabama | $69,032 | 87.9 |
| 49 | Mississippi | $67,147 | 85.5 |
| 50 | Oklahoma | $66,284 | 84.4 |