Key Takeaways
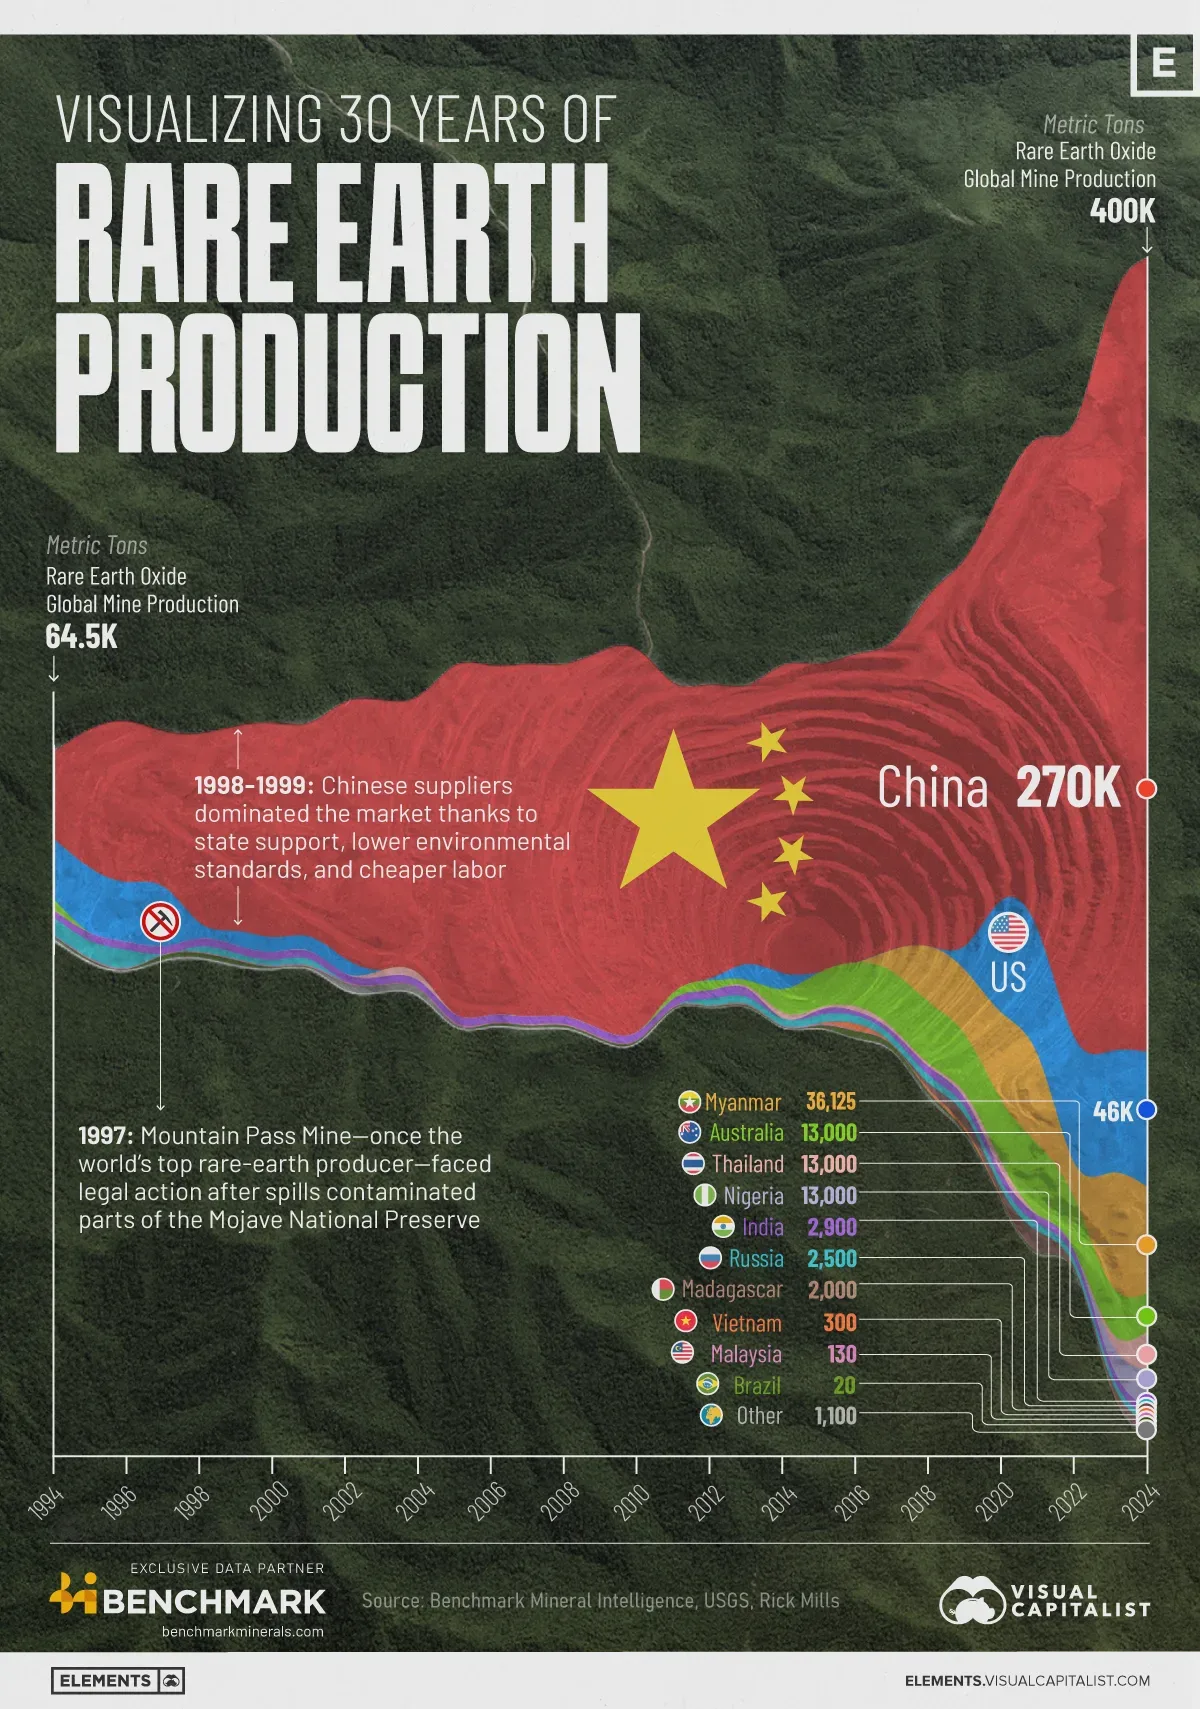
- China’s share of rare earth oxide (REO) mine output climbed from around 47% (1994) to almost 70% (2024), cementing its dominance.
- Global REO production more than doubled since 2018.
The global rare earths industry has transformed over the last three decades.
In the 1990s, the U.S. was still a major producer, anchored by the Mountain Pass mine in California. However, after a wastewater-related legal action in 1997 involving the mine, U.S. output collapsed, creating space for China to scale rapidly.
This visualization tracks those shifts in mine production from 1994 to 2024. The data comes from Benchmark Mineral Intelligence and the U.S. Geological Survey (USGS).
| REO Mine Production | 1994 | 2004 | 2014 | 2024 |
|---|---|---|---|---|
| 🇺🇸 United States | 20,700 | 0 | 5,400 | 45,855 |
| 🇦🇺 Australia | 3,300 | 0 | 8,000 | 13,000 |
| 🇧🇷 Brazil | 400 | 0 | 0 | 20 |
| 🇨🇳 China | 30,600 | 95,000 | 105,000 | 270,000 |
| 🇮🇳 India | 2,500 | 2,700 | 0 | 2,900 |
| 🇲🇾 Malaysia | 234 | 250 | 240 | 130 |
| 🇹🇭 Thailand | 150 | 2,200 | 2,100 | 13,000 |
| 🇷🇺 Russia | 6,000 | 0 | 2,500 | 2,500 |
| 🇳🇬 Nigeria | 0 | 0 | 0 | 13,000 |
| 🇲🇬 Madagascar | 0 | 0 | 0 | 2,000 |
| 🇻🇳 Vietnam | 0 | 0 | 0 | 300 |
| 🇲🇲 Myanmar | 0 | 0 | 0 | 36,125 |
| 🌍 Other countries | 548 | 2,000 | 0 | 1,100 |
| 🌐 Total | 64,500 | 102,000 | 123,000 | 399,930 |
Read more: Visual Capitalist