Key Takeaways
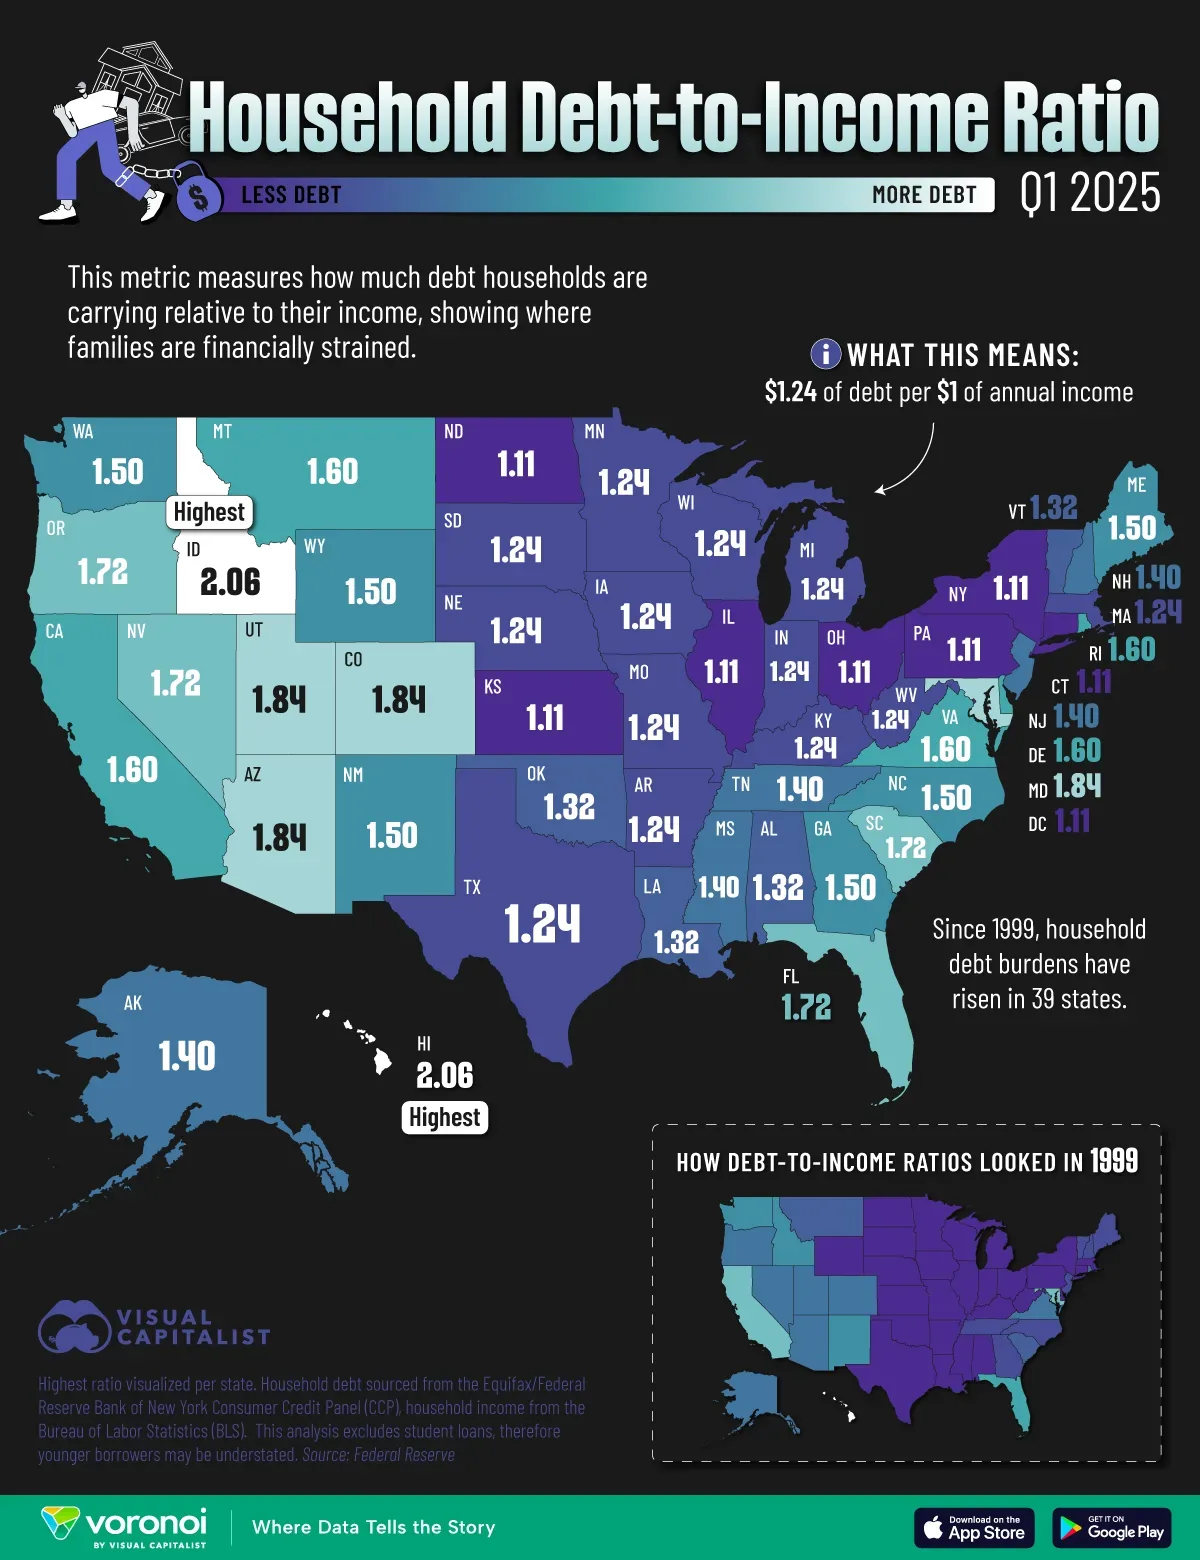
- Hawaii and Idaho have the highest debt-to-income (DTI) ratio of the states at 2.06.
- This means households carry about $2 in debt for every $1 in annual income.
- High ratio states (~1.7–2.1) are often places with expensive housing or fast population growth (bigger mortgages, newer borrowers).
Americans are always worrying about debt: their own and their government’s.
This visualization maps each state by their household debt-to-income ratios (DTI) in Q1, 2025, revealing which states carry the heaviest burdens and which ones keep borrowing in check.
Read more: Visual Capitalist